Recently, there are some new signs in China's
economy revealed by macro and micro data, which offer us a chance to find out
the real situation of China's economy and are important for allocating assets in
the future.

Source: Internet
1. Strong production yet weak demand,
positive micro data yet negative macro data: What's the real situation of China's
economy?
On one hand, there is a decline of growth
rate both in investment and social credit financing. In July, new loan
increment of RMB reached to RMB463.6 billion, RMB1.01 trillion less increase
YoY. Since the beginning of this year, investment growth rate keeps falling,
with manufacture investment and private investment dropping largely. In
particular, the growth rate of private investment in July turned negative YoY.
On the other hand, sales of real estate get
heated, orders of PPP (Public- Private Partnership) grow greatly, industrial
production keeps stable, the consumption of coal for generating electricity
stays high, the production of crude steel climbs higher, the prices of cement
and glass rebound, the sales of engineering machines boost, and the enterprise
profits, especially in the cyclical industries, improve more than anticipated.
In August, the growth rate of coal consumption for power generation was 8.7%, a
slight increase compared with 7.1% in July. In the first seven months of this
year, the total profits made by industrial enterprises above designated size
rose by 6.9%, 0.7% higher than that in H1 2016. In particular, the growth rate of
profit in July reached to 11%. What's more, the sales figure of excavator in
August was 4,370, up by 44.9% YoY.
So we think the economy in real condition
operates better than that reflected by macro data though the figures of social
credit financing and investment appeared negative. There was probably a small
cyclical re-rise in H1 2016 and the economy is in a stabilized state of L-shape
development at present.
2. Several proofs for L-Shape Economy
In 2015, we once put forward that as the
real estate investment touched the bottom, China's economy development would be
like L-shape for a long time.
This year, the macro economy operation basically
verifies our prediction about L-shape economy: heated sales of real estates and
lands, strong support from PPP, over expectation of supply shrink, the end of
de-stocking as well as the rebound of commodity prices.
2.1 Sales of real estate getting heated
In the background of money over issue, low
interest and policy encouraging people to use leverage, the sales of real
estate from 2014 to 2016 get boomed, pushing the housing price to rocket.
The hot sales of real estate drive other
relative investment and consumption. In the first seven months, accumulated
sales of commercial housing grew by 26.4%, newly started floor space rose by
13.7% YoY and investment of real estate development increased by 5.3%, all of
which enjoyed a large rebound compared with that in 2015. Besides, the hot
sales of real estate drive other relative consumption, such as decoration, building
materials, furniture and appliance.
Graph1: Sales on real-estate market in
China (Unit: %)
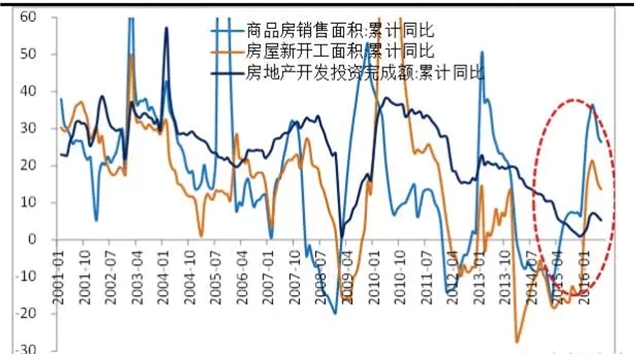
Sales areas of apartments: YoY
changes
New construction
areas of apartments: YoY changes
Completion of development and
investment on real-estate market: YoY changes
Source: Founder Securities
2.2 Strong support from PPP and the orders
of capital construction rocketing
Recently, there are three issues that are
over expectation about PPP: policy, practice and company performance.
Constricted by booming price of real
estate, policy of de-leverage and expectation for raising interest rate by FED,
recent monetary policy returns to neutral and prudent. In 2014 and 2015, the
monetary policy leaded in the policy mix. But this year, the fiscal policy,
which functions more in stabilizing economy growth, is placed in a more
important position. There are usually two ways for its direction: one is to
enlarge budgetary deficit (yet the deficit rate has reached to 3% this year);
the other is to seek other sources of fund (PPP is a very important approach). Under
the encouragement of the State Council, local governments, banks and
enterprises involve actively, pushing the practice of PPP model. In the
background of asset shortage and long-term interest rate going down, the will
to get into PPP for other capitals increases evidently. And it's expected that
the government may offer some policy benefits, such as tax reduction, fiscal
subsidy and project screening.
The project scale keeps growing. Since
2016, the demand for PPP projects continues to go up. According to the data
from PPP integrated information platform, the figures of programs and total
investment reached to 9,285 and RMB10.6 trillion at the end of June, up by
32.70% and 30.70% compared with that at the end of January.
Graph2: Investment volume of PPP projects
in 2016 (Unit: trillion RMB)
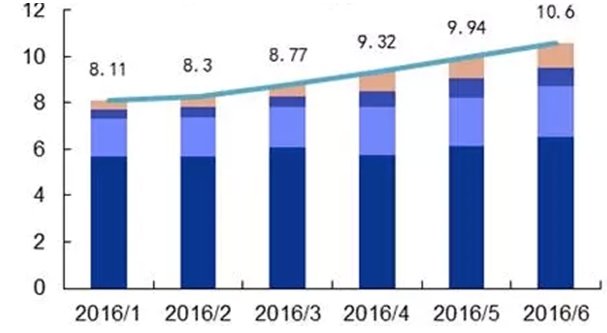
Execution
phase; Purchase
phase; Preparation phase; Recognition phase; Total
Source: China's Ministry of Finance, Founder
Securities
Policies are introduced intensively. Since
the concept of PPP and the framework guidance opinions for its development
model were put forward officially by Ministry of Finance in 2014, the PPP
projects were spread gradually in China. In 2015, more relative policies were
introduced, covering guidance on project operation, mechanism of investment and
financing, planning of fiscal budget, evaluation of project and distribution of
rights and responsibility. With the support of these policies, this year is
expected to witness the accelerated practice of PPP projects.
The increase of PPP manufacture orders also
can be proved by much more sales of engineering machine. According to the data
from Chinese Construction Machinery Business Network, the sales figure of
excavator in August reached to 4,370, up by 44.9% YoY and 19.3% MoM. From the
perspective of product types, the sales of both large-sized excavator and small-sized
excavator achieved rapid growth, with the former increasing by 69.6% and the
latter rising by 56.8% YoY. In general, large-sized one is mainly used to
mining and large-scale capital construction while small-sized one to municipal
engineering, park and garden construction, real estate development and so on.
So it's inferred that the price rise of black-series and nonferrous metal
pushed the upturn of mining, and the urban infrastructure and PPP projects
boosted sales of excavator.
Graph3: Sales of construction machinery in
China
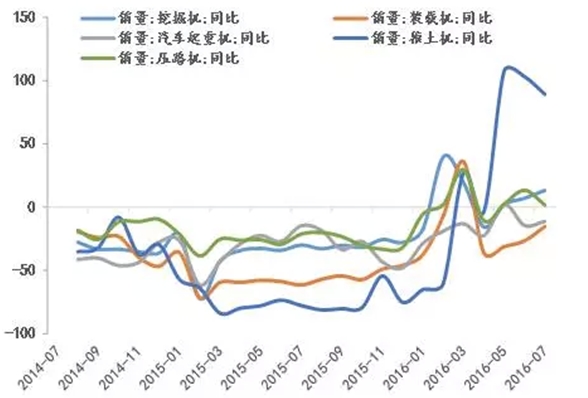
Sales of excavator: YoY change Sales of
truck crane: YoY change
Sales of loader: YoY
change Sales of road roller:
YoY change
Sales of bulldozer: YoY change
Source: Founder Securities
2.3 Excess capacity is cut cyclically and
administratively, and supply side was shrinked more than expectation
In G20 Meeting, President Xi Jinping,
pointed out that China has made every effort to reduce excess capacity as it
announced before. Resolving overcapacity is a major task for supply-side
reform. From 2016, China plans to reduce crude steel production by 100 million
- 150 million tonnes within 5 years, and decrease capacity of coal by 500
million tonnes, and lessen 500 million tonnes of coal by restructuring in 3 to
5 years. What's more, the State Council will supervise the process of cutting
excess capacity from place to place in the second half of the year.
Various kinds of signs indicate the
positive progress in shrinking supply side, especially in coal industry. In
2016, the production of coal dropped evidently, with the production being 268
million, 263 million, 277 million and 270 million tonnes from April to July and
down by 11%, 15.5%, 16.6% and 13.1% YoY, respectively, thus pushing up the
reduction of inventory and the rise of price. Besides, the stock of cement
showed a downtrend compared with that at the beginning of the year. The
production of crude steel was 804 million tonnes in 2015, down by 2.3% YoY,
marking the first time to be down in the past 10 years. Virgin Aluminum, a kind
of nonferrous metal, experienced an evident decline in production since H2
2015.
Governments at all levels carry out the
plan of reducing excess capacity strictly. In Shanxi province, 15 coal mines
will be shut down, cutting the coal production of 10.6 million tonnes per year.
Hebei province also publicized the elimination list, involving 16 million
tonnes of ironmaking production from 39 iron and steel enterprises. Besides,
Henan province declared that iron and steel industry should complete the
mission of cutting excess capacity by the end of October, and the coal industry
by the end of November. The State-owned Assets Supervision and Administration
Commission have set the capacity-reduction schedule for central enterprises,
requiring the central enterprises cut 10% of the excess capacity within two
years, and clearing 345 large and medium-sized zombie enterprises within 3
years.
Graph4: Output of coal in China
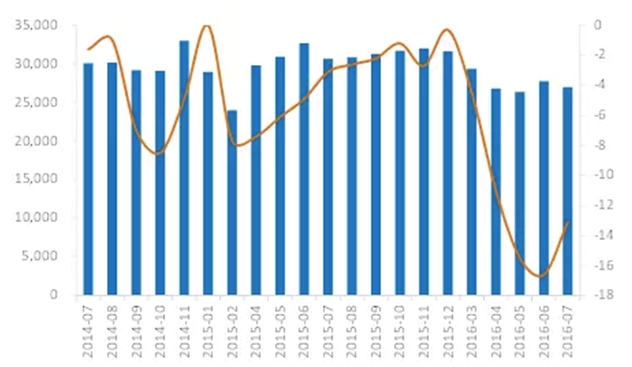
Output of coal; Output of coal: MoM change
Source: Founder Securities
2.4 Price of commodity rebounding, company performance
improving
After two years' decline, the price of
commodity began to rebound since early 2016, improving some companies'
financial performance. The increase can be attributed to the end of de-stocking
process, heated real estate investment and sales, the support of PPP and the
cyclical and administrative capacity reduction.
In August, PPI went down by 0.8% YoY, but
rose by 4.5% compared with that at the beginning of this year, and the figure
is expected to turn positive in Q4 2016. What's more, the price of some cycle
commodities, including steel, coal, cement, glass, crude oil and zinc,
rebounded.
The
total profit of industrial enterprises above designated size in the seven
months of this year rose by 6.9% YoY, 0.7% higher than that in the first half
year, with the profit in July reaching to 11%. Within
it, the iron and steel industry and nonferrous metal industry contributed a
lot.
Graph5: Finished goods inventory index in
China (%)
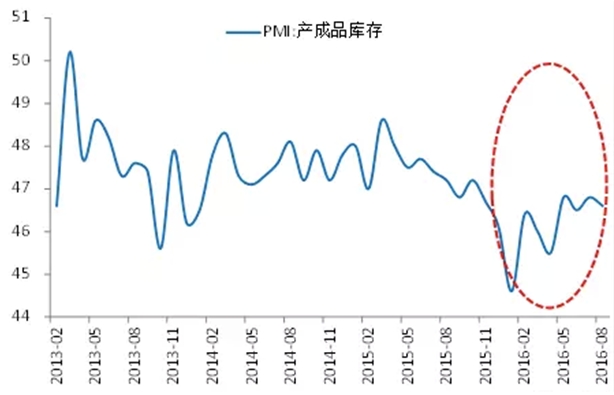
Finished goods inventory index
Source: Founder Securities
*The
article is edited and translated by CCM. The original one comes from Laohucaijing.com.
About CCM:
CCM is the leading market intelligence
provider for China's agriculture, chemicals, food & ingredients and life
science markets. Founded in 2001, CCM offers a range of data and content solutions, from price
and trade data to industry newsletters and customized market research reports. Our clients include Monsanto, DuPont, Shell, Bayer, and Syngenta. CCM is a
brand of Kcomber Inc.
For
more information about CCM, please visit www.cnchemicals.com or
get in touch with us directly by emailing econtact@cnchemicals.com or
calling +86-20-37616606.