“In the recent
years, China’s economic data have boldly diverged, and thus it turned to be
more and more difficult to estimate the running condition of macro economy.
Under the background of the ongoing policies that designed for stabilizing
growth, how to explain the all-the-way investment downturn and data divergence?”

Source: Internet
Recently, China’s
economy faced a bold data divergence, which made it more difficult to estimate
the running condition of macro economy. For example, the main macroeconomic
data of July showed a wide depression and at the same time kept declining,
however, in August, the official PMI of manufacturing industry was 50.4 in
August, which was a record high in the previous 22 months and showed a positive
sign for economic growth, moreover, the hugely increasing industrial
enterprises profits and electricity output in July strongly contrasted with the
depressed industrial production and reducing investment.
The profit of
industrial enterprises above the designated size year-on-year increased by 11%
in July, 5.9 percentage point faster in terms of growth rate than that of June.
The year-on-year growth rate of the output of electricity generating increased
from 2.1% in June to 7.2% in July, but at the same time, the industrial added
value above the designated size increased by 6%, which was 0.2 percentage point
lower than that of June. Moreover, the investment on the fixed assets decreased
to 8.1% during January to July, which was 0.9 percentage point lower than that
of the period ranged from January to June. Under the ongoing policies that
aimed to stabilize the growth, it’s noteworthy that the investment has all the
way declined and the data have diverged.
What’s the logic
chain behind all those layers of mist? Would the economic situation be stabilized
or kept in the downturn?
The Divergence between the Reduction on the Industrial
Production and the Improvement on the Output of Electricity and Profits
One aspect that
worth paying attention to was the mystery of the divergence among the reducing
industrial added value, strong generating capacity, and increasing profit. According
to statistics, the industrial added value above the designated size increased
by 6%, which was 0.2 percentage point lower than that of June. However, the
profit of industrial enterprises above the designated size increased by 11%
year-on-year in July, which, accelerated by 5.9 percentage point than that of
June, created a record high in the previous four months. The output of
electricity and power consumption hugely increased in July: the year-on-year
growth of the former increased from 2.1% of June to 7.2% and of the latter
increased from 2.6% in June to 8.2%.
Graph 1:
Divergence between the Industrial Production and Generating Capacity
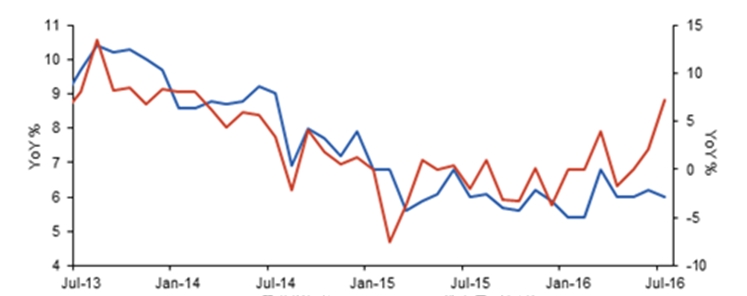
Industrial Added
Value Generating
Capacity (right axis)
Generally
speaking, there’s a strong positive correlation between the generated energy
and industrial production, and thus it’s really abnormal about this divergence.
The Statistical Bureau offered three reasons for this phenomenon: first of all,
the increasing electricity consumption due to the high temperature, secondly,
the short-term adverse effect on the industrial production caused by the flood disaster;
thirdly, the low cardinal number of the industrial electricity consumption. However,
the three reasons above were not solid enough as they still diverged from the
statistics.
About the first
reason, of course the high temperature would greatly influence the residential
electricity consumption and the consumption of service industry, and thus the
year-on-year growth rate of the residential electricity consumption in the
urban and rural areas increased from 5.4% of June to 9.6% of July, and that number
of the service sector increased from 8% of June to 15.3% of July. As the
electricity consumption of the residents and service sector only accounted for
25.6% of the total electricity consumption, the increasing electricity consumption
of the residents and service sector due to the high temperature just
contributed 1.5 percentage point to the increasing electricity from the overall
perspective.
Some views
believed that the high temperature also has been one of the factors that drove
up the electricity consumption in the secondary industry, for example, the
year-on-year growth rate of the electricity consumption in the secondary
industry increased from 1.4% of June to 6.9%, among which the growth of the
industrial electricity accelerated from 1.4% to 6.9% and the manufacturing
industry increased from 0.5% to 4.9%. But from author’s point of view, it’s not
reasonable to attribute the increasing electricity consumption of the secondary
industry to the high temperature: the July of 2010 used to be the hottest in
the same period of the recent years, but the year-on-year growth rate of the
July of 2010 slowed down from 15.8% of June to 15.4%, among which the
industrial electricity consumption growth reduced from 15.7% to 15.4% and the
consumption of the manufacturing industry declined from 19.8% to 15.7%.
As for the second
reason, we can find that the damage caused by the disaster in each province
were not exactly matched with the slowing down industrial production. For
example, according to the report analyzing the disaster condition of July
released by Ministry of Civil Affairs, provinces of Hebei, Hubei, Anhui, and
Henan were heavily suffered from disasters, while the industrial growth of all
those four provinces were 5.1%, 8.3%, 7.7% and 7.6% respectively, which,
respectively were 0.1, 0, 1.4 and 0.6 percentage point lower than that of June,
can be seen as a slight reduction. And in some areas that suffered disasters,
like Hunan, Guizhou, Jiangxi, Jilin, Beijing, and Sichuang, the growth of the
industrial added value in July was even higher than that of June. Provinces
with the highest reduction were not influenced by the disaster, for example,
the industrial added value of Xinjiang, Xizang, and Hainan were respectively
decreased by 7, 4.5 and 2.6 percentage point, which cannot be explained by the
side effect of flood disaster.
The third reason
was cardinal number effect. According to the statistics of Statistical Bureau,
the output of electricity of July last year decreased by 2.02% year-on-year,
but the author remained suspicious whether the flat cardinal number last year
caused the remarkable increase of the output of July this year? According to
Statistical Bureau, in July 2015, the output of electricity was 509 billion kilowatt-hour,
while in the same period of 2014, the output was 505 billion kilowatt-hour,
based on these two set of statistics we can get a year-on-year growth of 0.8%,
rather than the -2.02% released in the previous period. With the statistics of
no transparency, people would inevitably doubt about the explanation of
cardinal number effect.
Moreover,
according to the industry data, among all those 27 sectors, 18 of which enjoyed
an increasing growth rate of industrial added value, the emerging products of
consumption upgrading were prosperous in both production and sales. For
example, in January to July, the year-on-year growth of new energy automobile,
SUV, carbon fiber reinforced composite, solar battery, industrial robot, mobile
phone, and optical fiber were 94.6%, 37.7%, 36.7%, 26.4%, 27.2%, 23.8%, and
31.3% respectively. At the same time the high-value-added industries have also
been in good prospect. From January to July, the year-on-year growth of the manufacturing
of radar and its accessory equipment, tramway, and aerospace vehicle and its
accessory equipment, nuclear radiation processing, communication device
manufacturing, nuclear fuel processing, and battery manufacturing were 61.5%,
39%, 24.2%, 18.8%, 18.5%, 16.1% and 16% respectively.
*The
article is edited and translated by CCM. The original one comes from Laohucaijing.com.
About CCM:
CCM is the leading market intelligence
provider for China’s agriculture, chemicals, food & ingredients and life
science markets. Founded in 2001, CCM offers a range of data and content solutions, from price
and trade data to industry newsletters and customized market research reports. Our clients include Monsanto, DuPont, Shell, Bayer, and Syngenta. CCM is a
brand of Kcomber Inc.
For
more information about CCM, please visit www.cnchemicals.com or
get in touch with us directly by emailing econtact@cnchemicals.com or
calling +86-20-37616606.